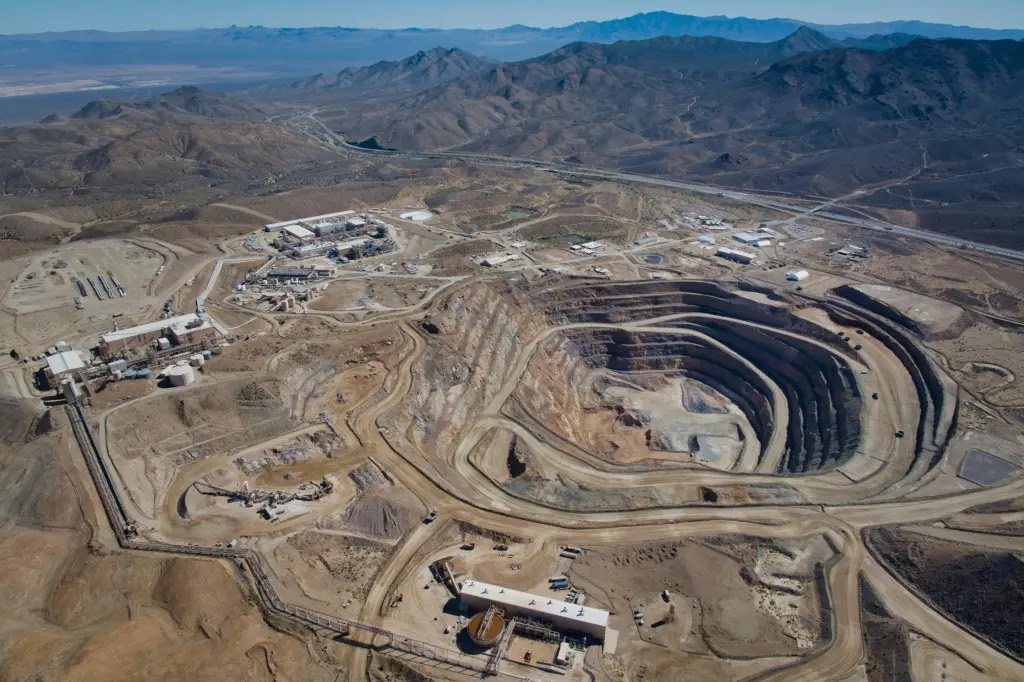
Seventeen obscure metals sit inside every EV motor, wind turbine, fighter jet and smartphone — and one country separates nine-tenths of them. This site tracks where rare earths are mined, separated and turned into magnets, using open data from USGS, the IEA and trade records.
0kt REO mined worldwide, 2025 (USGS est.)
0of world mine output from China, 2025
0of refining & separation done in China (IEA, 2024)
0of sintered NdFeB magnets made in China (2024)
Interactive map
The rare earth world map
Producing mines, separation and refining plants, magnet factories and development projects. Tap a marker for details; toggle layers below. Circle size ≈ scale of operation.
"Rare earths" are the 15 lanthanides plus scandium and yttrium: chemically so similar they occur together in the same ores and must be painstakingly separated. A handful — neodymium, praseodymium, dysprosium, terbium — carry most of the market's value. Tap an element.
Light rare earthHeavy rare earthExport-controlled by China (Apr 2025)Oct 2025 controls (suspended Nov 2025)
Mine to magnet
The journey of a rare earth
From ore in the ground to the magnet in an EV motor, rare earths pass through some of the most concentrated industrial chokepoints in any supply chain — nearly all of them in China.
← swipe →
Production & reserves
Where rare earths come from
Mine production by country, 2025
Metric tons of rare-earth-oxide (REO) equivalent, log scale (USGS estimates)
Source: USGS Mineral Commodity Summaries 2026. Myanmar's output is estimated from Chinese import data.
Reserves by country
Million metric tons REO (world total > 75 Mt)
Source: USGS Mineral Commodity Summaries 2026. Reserves for Burma, India, Madagascar, Nigeria and Thailand not available.
World mine production, 2018–2025
Metric tons REO per year — output has roughly doubled since 2018, driven by magnet demand
Source: USGS Mineral Commodity Summaries (annual editions, approximate)
Separation
Where — and how — rare earths are separated
Mining is the easy part. Because the 17 elements are chemically near-identical, splitting them into pure oxides takes hundreds of solvent-extraction stages, radioactive waste handling and decades of process know-how. The IEA estimates China performed ~91% of the world's rare earth refining in 2024 — and until Lynas started in 2025, essentially 100% of heavy-rare-earth separation.
Separation geography
Two Chinese clusters dominate, for two different reasons
🇨🇳Baotou & the north
Bayan Obo's light-REE concentrate feeds the world's largest processing complex at Baotou, Inner Mongolia — separation, metal-making and magnet alloys at a scale no other country approaches, run by China Northern Rare Earth.
🇨🇳Ganzhou & the south
Ion-adsorption clays across Jiangxi and neighbouring provinces yield the heavy rare earths (Dy, Tb). Separation clusters around Ganzhou under the state-owned China Rare Earth Group — along with a costly legacy of in-situ leaching pollution.
🌍The ex-China ~9%
Lynas (Kuantan, Malaysia — most of it), Solvay's La Rochelle (France), Neo's Silmet (Estonia), Energy Fuels' White Mesa (Utah) and MP's Mountain Pass. New capacity is coming: Caremag (France), REEtec (Norway), Ucore (Louisiana), Iluka's Eneabba refinery (Australia, 2027).
⚠️Why it matters
In December 2023 China banned the export of rare-earth extraction, separation and magnet-making technology. The 2025 export controls then weaponised the separation chokepoint itself — licences now gate every shipment of controlled heavy rare earths.
Sources: IEA Global Critical Minerals Outlook (2025); USGS MCS 2026.
From ore to magnet, step by step
Primary route (top) and recycling (bottom) converge at separation. Scroll sideways on mobile →
Process descriptions: USGS; IEA; industry sources. Solvent-extraction separation of adjacent lanthanides can require over 100 stages per split.
Magnets
The magnet is the market
Permanent magnets are the leading global end use of rare earths and carry most of the market's value. Sintered NdFeB — neodymium-iron-boron, doped with dysprosium or terbium for heat tolerance — is the strongest magnet ever commercialised, and there is no drop-in substitute.
🚗EVs & hybrids
A typical EV traction motor uses roughly 1–3 kg of NdFeB magnets. Most EVs on the road use permanent-magnet motors — the biggest single driver of rare earth demand growth.
🌬️Wind turbines
Direct-drive offshore turbines carry the largest magnets of all — on the order of 600 kg of NdFeB per megawatt, several tonnes per turbine.
📱Electronics
Speakers, haptics, camera autofocus, hard-disk actuators: grams per device, but billions of devices. Apple alone signed a $500M deal for US-made recycled magnets.
🤖Robots & drones
Every joint in a humanoid robot is a magnet motor. Robotics and drones are widely projected to be the next structural source of NdFeB demand after EVs.
94%of the world's sintered NdFeB magnets were made in China in 2024 (IEA). Japan makes most of the rest; every announced US and European plant together adds a few percent of world supply.
The Western magnet buildout
Sintered NdFeB capacity at new US & European plants, tonnes per year — operating vs announced targets
Sources: company disclosures (MP Materials, e-VAC Magnetics, Neo Performance, USA Rare Earth, Noveon). For scale: China's sintered NdFeB output is measured in hundreds of thousands of tonnes.
Geopolitics
The export-controls timeline
Rare earths went from trade commodity to geopolitical instrument. What began as a two-month embargo against Japan in 2010 became, by 2025, a licensing regime covering half the periodic table's bottom row.
Sep 2010
The Senkaku embargo
After a fishing-boat collision near the disputed Senkaku/Diaoyu islands, China halts rare earth shipments to Japan for about two months. Prices spike as much as tenfold; Japan bankrolls Lynas to build the first major ex-China supply chain.
2014–2015
WTO ends export quotas
The US, EU and Japan win a WTO case against China's rare earth export quotas. China scraps them — but keeps production quotas and consolidates the industry into state-owned groups.
Dec 2023
The technology ban
China bans the export of rare-earth extraction, separation and magnet-manufacturing technology — locking in the know-how moat just as Western separation projects seek engineers and flowsheets.
Apr 2025
Seven elements go under licence
Answering US tariffs, China imposes export licences on samarium, gadolinium, terbium, dysprosium, lutetium, scandium and yttrium — and on magnets containing them. Shipments stall for weeks; Ford halts an Explorer line in Chicago; automakers worldwide fly in engineers to redesign around missing magnets.
Jun–Aug 2025
Licences thaw, Washington answers
A London framework restarts licence approvals for civilian users. The US Department of Defense takes a $400M stake in MP Materials with a $110/kg NdPr price floor and a 10-year magnet offtake — the Pentagon becomes a rare earth investor.
Oct 2025
The 50% rule
China adds europium, holmium, erbium, thulium and ytterbium — all heavy rare earths — plus an extraterritorial rule covering foreign-made goods containing Chinese rare earth content, and controls on magnet-making equipment. The escalation lands weeks before the APEC summit.
Nov 2025
The Busan truce
After the Trump–Xi meeting, China suspends the October package for one year (to 10 November 2026). The April controls stay in force, with "general licences" issued to selected exporters for civilian trade.
2026
A two-price world
Civilian flows resume under general licences, but defence-linked buyers remain effectively embargoed. Outside China, dysprosium trades around 4–5× and yttrium at over 100× Chinese domestic prices — a standing subsidy for every ex-China separation project.
Sources: USGS MCS 2026; MOFCOM announcements via White & Case and China Briefing; IEA; press reports (Reuters, MINING.com).
Trade & prices
Who ships to whom — and at what price
The US now mines more rare earths than it did at any point since the 1990s — yet still imported 67% of the compounds and metals it consumed in 2025, and 100% of its heavy rare earths.
US import sources, rare-earth compounds & metals
Average shares 2021–2024. Malaysian, Japanese and Estonian material is largely separated from Australian and other ore.
Source: USGS MCS 2026 (China includes Hong Kong)
Benchmark prices, 2021–2025
Average $/kg of oxide, log scale — the magnet metals vs the heavy additives
Source: USGS MCS 2026 (Argus / Asian Metal assessments, Chinese FOB)
The two-price world
Chinese domestic vs ex-China prices after the 2025 export controls
Dysprosium oxide
$239/kg average in 2025 (Chinese FOB) → roughly $1,450/kg outside China by May 2026.
Terbium oxide
$1,010/kg average in 2025 → around $4,500/kg outside China by May 2026.
Yttrium oxide
A cheap workhorse — until controls hit. Ex-China prices rose over 100-fold, approaching $1,100/kg in May 2026.
NdPr — the exception
Never controlled, but rallying anyway: Chinese NdPr alloy hit ~$133/kg in July 2026, up over 80% year-on-year, as magnet demand outruns quota growth.
China's heavy-rare-earth feedstock comes largely from across the border
Kachin State's ion-adsorption clay mines — over 300 sites, up from ~130 in 2020 — supply the bulk of China's imported heavy-rare-earth feedstock, an estimated 22,000 t REO in 2025. Since October 2024 the mining belt has been controlled by the Kachin Independence Army, which taxes exports at a negotiated ~35,000 yuan per tonne. Every border closure and levy dispute whipsaws the dysprosium and terbium supply that the world's EV motors depend on.
~22 ktREO mined in Myanmar in 2025 (USGS estimate from Chinese import data) — the world's third-largest producer, with no functioning state oversight.
Concentration deepens at every step downstream from the mine — and the IEA expects China to remain the dominant refiner well into the 2030s, even if every announced Western project delivers.
91%
of the world's rare earth refining happened in China in 2024 (IEA). Its estimated share along the mine-to-magnet chain:
Sources: USGS MCS 2026 (mining, 2025); IEA Global Critical Minerals Outlook 2025 (refining, magnets, 2024). Heavy-REE separation was ~100% China until Lynas Malaysia began producing Dy and Tb in mid-2025.
Dual use
Rare earths as military materials
Precision-guided weapons, radar, sonar, jet engines and night vision all depend on rare earths — which is why China's export-control rules explicitly target defence supply chains, and why the Pentagon has become the industry's anchor investor.
✈️Fighter jets
An F-35 contains roughly 400 kg of rare earth materials — in magnets for actuators and generators, radar components and engine coatings. Yttria thermal-barrier coatings keep turbine blades alive.
🚢Submarines & ships
A Virginia-class submarine carries an estimated 4+ tonnes of rare earth materials. Sonar transducers use Terfenol-D, a terbium-dysprosium-iron alloy with no substitute.
🚀Missiles & munitions
Samarium-cobalt magnets drive fin actuators and seekers in precision-guided munitions — they keep working at temperatures where NdFeB fails, which is why samarium led China's April 2025 control list.
🔦Lasers & optics
Nd:YAG rangefinders and target designators, erbium and holmium battlefield lasers, lanthanum in night-vision optics — rare earth photonics run modern targeting.
📦The stockpile
The US National Defense Stockpile's FY2025 shopping list included 300 t of NdPr oxide, 450 t of NdFeB magnet block and 60 t of samarium-cobalt alloy (USGS).
🚫The licence gap
China's 2026 general export licences ease civilian trade — but defence-linked end users remain effectively embargoed, leaving Western primes reliant on stockpiles and the still-tiny ex-China heavy-rare-earth supply.
Sources: US DoD / Congressional Research Service figures widely cited for F-35 and Virginia-class REE content; USGS MCS 2026; press reports.
Capital flows
Where the rare earth money is going
2025–26 rewired the sector: for the first time, Western governments stopped writing reports and started writing cheques — equity, price floors and offtakes. Four places where capital is concentrating — presented as observation, not investment advice.
🇺🇸Price-floor capitalism
The DoD's MP Materials package — $400M of equity, a $110/kg NdPr floor and a 10-year magnet offtake — created a template: Washington has since extended a $96M purchase intent to Lynas on similar terms, plus loans for heavy separation and recycling. Its development-finance arm reaches further: the DFC has pledged support for rare-earth projects in Angola, Malawi and South Africa, while Saudi Arabia's Ma'aden has announced rare-earth partnerships in East and Southern Africa.
🧲The magnet buildout
Well over $2B is flowing into US magnet plants: MP's $1.25B 10X campus in Texas (Apple-anchored), e-VAC's Sumter plant, USA Rare Earth's Stillwater, Noveon's San Marcos. Qualification with automakers and primes still takes years.
⚗️The heavy-REE gap
Dysprosium and terbium at 4–5× Chinese prices make heavy separation the scarcest, best-rewarded asset: Lynas Malaysia, MP's DoW-funded circuit, Caremag in France, Serra Verde's $465M DFC loan in Brazil, and Ucore's Louisiana plant all chase it.
⚠️The risks
NdPr prices are still set in China and can be flooded at will; ionic-clay economics are unproven outside Asia; the Busan truce could reverse either way; most Western projects only pencil with policy support — remove the floor and the old cycle returns.
This section describes where capital is flowing, based on public data. It is not financial advice.
Sources: company and government disclosures; USGS MCS 2026; MINING.com; Reuters; OECD (2026) on African projects.
Company tracker
The companies that move rare earths
Producers, separators, magnet makers and developers across the chain. In China two state groups control mining quotas; the concentration deepens downstream, where a handful of magnet makers supply the world. Filter by segment or search.
Company
Segment
Key assets
Status & recent signals
Company status reflects public disclosures as of July 2026. This is an observational tracker, not investment advice.
Sources: company disclosures & filings; USGS MCS 2026; IEA; DoD, EXIM, DFC and DOE announcements; trade press (MINING.com, Reuters, Fastmarkets).
Data & methodology
Open data sources
USGS Mineral Commodity Summaries 2026 — Rare Earths — world production, reserves, US trade and prices. Production figures for 2025 are estimates; Myanmar, Madagascar, Malaysia, Thailand and Vietnam output estimated from Chinese import data.
Prices — Argus Media / Asian Metal assessments via USGS (2021–2025 averages); 2026 spot context from The Oregon Group and SMM/Trading Economics benchmarks.
Export controls — MOFCOM announcements analysed by White & Case and China Briefing; USGS MCS 2026 events summary.
Notes — Mine and plant coordinates are approximate. Refining and magnet shares are IEA/industry estimates; official statistics do not fully separate magnet-grade material. Last data refresh: July 2026.
FAQ
Common questions
Are rare earths actually rare?
No — cerium is about as abundant in the Earth's crust as copper. What is rare is finding them concentrated enough to mine economically, and the industrial capacity to separate 17 chemically near-identical elements from each other. The whole world mined only about 390,000 tonnes of rare-earth oxide in 2025.
Who produces the most rare earths?
China mined about 270,000 of the world's 390,000 tonnes of rare-earth oxide in 2025 — roughly 69% — according to USGS estimates. Much of the rest, including Myanmar's heavy-rare-earth output, is still refined in China.
Why does China dominate rare earth refining?
The IEA estimates China performed about 91% of the world's rare earth refining and made about 94% of sintered NdFeB magnets in 2024. Decades of state investment, tolerance of the radioactive and chemical waste from separation, the scale of Bayan Obo, and a 2023 ban on exporting separation and magnet-making technology all entrench the position.
What are rare earths used for?
The leading global use is permanent magnets — NdFeB magnets in EV motors, wind turbines, electronics and defence systems. Other uses include catalysts, polishing, phosphors, lasers, fibre optics and medical imaging.
What did China's 2025 rare earth export controls do?
In April 2025 China imposed export licences on samarium, gadolinium, terbium, dysprosium, lutetium, scandium and yttrium and on magnets containing them, briefly halting car production lines worldwide. An October 2025 expansion was suspended for one year in November, but the April controls remain, and outside China dysprosium and terbium have traded at four to five times Chinese domestic prices.
Need a deep-dive report on rare earths?
That's exactly what we do. We produce commissioned deep-dive reports on rare earths, covering angles such as mine-to-magnet supply-chain mapping, exposure to China's export controls element by element, heavy versus light rare-earth availability, the ex-China buildout of separation and magnet capacity, and what it all means for autos, wind, electronics and defence programmes. Every report is source-cited — charts, maps and citations included — and built on the same open, verified data behind this dashboard. Email hello@mineral.watch with a short note on what you need and we'll come back with a scoped proposal.
Custom research
Need an ad hoc data-driven research report?
We produce bespoke, source-cited research on rare earths and other strategic minerals — supply-chain mapping, trade-flow analysis, country and commodity deep-dives — built on the same open data behind this dashboard.
mineral.watch is an independent data hub, and it grows with the people who use it. Introduce yourself and we'll let you know when the rare earths figures on this dashboard are updated and when new dashboards, datasets and research go live — no noise, just what's new.
Telling us your sector and organisation helps too: it shows us who relies on this data — analysts, policymakers, journalists, researchers — and shapes what we build next, from new minerals to custom research.
Prefer to talk directly? Corrections, data tips and collaboration ideas are always welcome at hello@mineral.watch.